Project Brief: Building the Growth Model for your Organisation
The why to this project
Growth modeling is a systematic approach to understanding, measuring, and driving growth in a business. It helps identify the key problems that need solving and the core levers that your organisation needs to double down on. Here’s a detailed step-by-step guide to help you through this process.
STEP 1 | Decide your northstar metric
This depends on your business model and the goals commonly picked by them. As per stage of your company your NSM changes over a period of time. For example -
Facebook
PMF stage
% activation rate
% new user retention
Early Scaling
# engaged sessions
# average time spent
Mature Scaling
% revenue retention
# active advertisers
# session frequency
Amazon
PMF
% activation rate
% new user retention
Early Scaling
% Retention
# paying customers
# frequency of purchase
Mature Scaling
% revenue retention
# paying customers
# frequency of purchase
$ Average order value
#CAC to LTV ratio
Spotify
PMF
% activation rate
% new user retention
Early Scaling
% Retention
# engaged sessions
#average time spent
Mature Scaling
#paying subscribers
% paid subscriber retention
# active advertisers
# session frequency
$ Average CPM
#CAC to LTV ratio
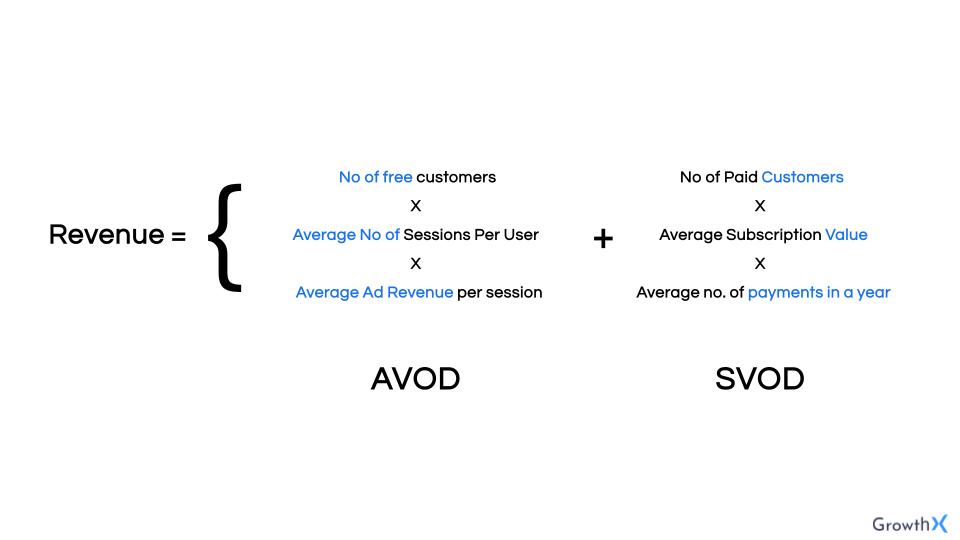
STEP 2 | Build the growth equation
The idea here is to put down the NSM and the two levers that impact it. Next you should go deeper into those two levers. So if your NSM = A+B then you need to break this down further by identifying metrics that make up each of these levers. For example -


STEP 3 | Collate current metrics of your product
Based on different components of your growth equation, you will need to put together the relevant data.
For example, if revenue is the NSM then you need to collect the data on the following -
Current monthly new users
Visit to signup rate
Sign-up to trial rate
Trial to purchase rate
1st purchase to 2nd purchase rate
Retention rate - M3/M6/M12/M18/M24
Current definition of casual users
Current definition of core users
Current definition of power users
Activation metric definition
Retention metric definition
Monetizable user definition
Current frequency of casual users
Current frequency of core users
Current frequency of power users
STEP 4 | Establish the nuke scenario
Calculate the impact on your NSM in a nuke scenario case
Identify Current Metrics:
- Current User Base: Total number of existing users.
- Retention Rates: The percentage of users retained over specific time periods ( monthly)
Calculate user base:
- Use retention rates to project the number of users who will remain active over future periods.
- Example: If you have 10,000 users with a monthly retention rate of 80%, after one month, you would retain 8,000 users (10,000 * 0.80).
Here’s a template you can use to input your data and calculate users in M12 if there there is no acquisition of new users. Once you have this number, you will need adjust your goal aligned to your NSM accordingly.
STEP 4 | Calculate Incremental Growth
Once you have built your growth equation and figured out your numbers in the case of a nuke scenario, you will now have a general idea of the problems that will need to be solved to meet your goal. bAsed on this, calculate the incremental growth in different aspects of your product.
Incremental growth, refers to the additional growth that is achieved by making improvements in various aspects of the product or service. These aspects include onboarding, retention, engagement, and monetization.
This can be calculated by comparing the current performance metrics to the target performance metrics after implementing specific changes or improvements. Calculating this will give you an idea of which broad lever you will need to double based on what has the maximum impact on you goal. Here are a few examples-
Onboarding:
- Current onboarding rate: The percentage of new users successfully onboarded with the current process.
- Target onboarding rate: The improved percentage of new users expected to be successfully onboarded after enhancements.
- Incremental growth: The difference in the number of users successfully onboarded between the current and target rates, multiplied by the total number of new users.
Retention:
- Current retention rate: The percentage of users retained over a specified period (e.g., M6, M12).
- Target retention rate: The improved percentage of users expected to be retained after implementing retention strategies.
- Incremental growth: The difference in the number of retained users between the current and target rates, multiplied by the total number of existing users.
Here’s a template that can help you understand how you can build this on a sheet and do your calculations. Note that the formulas and input data in this sheet is specific to when revenue growth is the NSM.
Template for advanced growth model
STEP 6 | Identify your core levers
Here, you need to pinpoint the primary levers that has the maximum impact on your NSM.
For example, based on your calculations in the incremental growth stage, you’ve come to the conclusion that monetization is the one lever that has the maximum impact on your growth objective. Once you know this, you can prioritise the sub levers within monetisation like Free to Paid conversions, increasing CPM, redesigning pricing page, introducing differential pricing etc.
Presenting your growth model
Presenting the growth model to your organisation requires a clear and concise structure. This enhances your credibility with stakeholders and makes them more likely to trust you. Further, it helps align them to the key solutions proposed by your model. To nail this, we will be using McKinsey’s Pyramid Principle.
The idea is -
Start with the main conclusion.
Mention each supporting key point.
Back every point with a detailed evidence.
Step 1 : Begin with the conclusion. Start with the main objective which explains the primary goal of your growth model. Here's an example -
"Our revenue goal is X. Our current ARPU is Y. We need to increase ARPU to achieve 30% of our revenue goal"
Step 2 : Create a list of your supporting arguments for your proposed solution. Here are a couple of examples -
- Explain the current revenue from monetisation experiments & ARPU rates
- Define the target ARPU rates & the expected incremental revenue growth that it will bring
- Outline the methods to increase ARPU.
- For example - increasing CPM ( in the context of AVOD), improving FTP (in the context of SVOD).
Step 3 : Accompany your supporting facts with data. Go one level deeper to support your argument from step 2. Here are a couple of examples -
- Present the set of current data points like current user acquisition rate, retention rates, and engagement metrics.
- Explain how with the current and projected rates, you can increase CPM to bring about a change in ARPU and its impact on revenue. Make the use of tables and graphs to help them visualize this data.
- Next propose the key action items to increase CPM - redesigning pricing page, improving placement of ADs, and improving cohort based targeting.
Brand focused courses
Great brands aren't built on clicks. They're built on trust. Craft narratives that resonate, campaigns that stand out, and brands that last.


All courses
Master every lever of growth — from acquisition to retention, data to events. Pick a course, go deep, and apply it to your business right away.


Explore courses by GrowthX
Built by Leaders From Amazon, CRED, Zepto, Hindustan Unilever, Flipkart, paytm & more
Course
Advanced Growth Strategy
Core principles to distribution, user onboarding, retention & monetisation.
58 modules
21 hours
Course
Go to Market
Learn to implement lean, balanced & all out GTM strategies while getting stakeholder buy-in.
17 modules
1 hour
Course
Brand Led Growth
Design your brand wedge & implement it across every customer touchpoint.
15 modules
2 hours
Course
Event Led Growth
Design an end to end strategy to create events that drive revenue growth.
48 modules
1 hour
Course
Growth Model Design
Learn how to break down your North Star metric into actionable input levers and prioritise them.
9 modules
1 hour
Course
Building Growth Teams
Learn how to design your team blueprint, attract, hire & retain great talent
24 modules
1 hour
Course
Data Led Growth
Learn the science of RCA & experimentation design to drive real revenue impact.
12 modules
2 hours
Course
Email marketing
Learn how to set up email as a channel and build the 0 → 1 strategy for email marketing
12 modules
1 hour
Course
Partnership Led Growth
Design product integrations & channel partnerships to drive revenue impact.
27 modules
1 hour
Course
Tech for Growth
Learn to ship better products with engineering & take informed trade-offs.
14 modules
2 hours
Crack a new job or a promotion with ELEVATE
Designed for mid-senior & leadership roles across growth, product, marketing, strategy & business


Learning Resources
Browse 500+ case studies, articles & resources the learning resources that you won't find on the internet.

Patience—you’re about to be impressed.